🌆🏠 GRAVESHAM PROPERTY STATS - OCTOBER 2024
The Gravesham Property Market (DA11 & DA12). Here we look at data for new listings, sales and the time its currently taking to sell a property. Data up to October 31st, 2024 📅
Headlines - DA11 & DA12
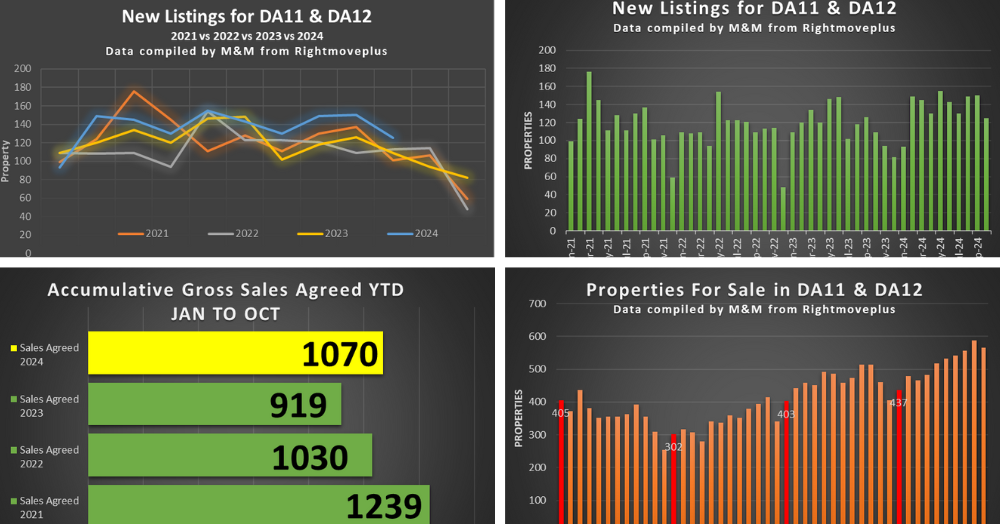
📈 Gravesend Property Market Sees a 10% Rise in Listings from October 2023 to 2024
📊 Gravesend Listings Hit 3-Year High: 12% Above Historical YTD Average
📈 Gravesend Property Sales Surge 22% in October 2024 Compared to Last Year
📈 Gravesend Property Sales Up 16% YTD: 1070 Homes Sold So Far in 2024
📅 October Sees Strong Sales: 125 Properties Sold STC – 17% More Than September.
Listings
- 📉 Listings for last Month (October 2024) increased by 10% when compared to October 2023 (from 514 to 565).
- 📈 Accumulative Total Gross Listings YTD (1369) are 11% higher than 2023 YTD levels and 17% higher than 2022.
- 📊 This year's YTD listing stand at 1369, which is 12% higher than the historical 3-year YTD average of 1219 properties.
- 💷 The average asking price in Gravesend, for ALL property types, at October 2024: £344,437 (an increase of 3% when compared to October 2023).
- 🏡 The average asking price in Gravesend, for a Detached property, at October 2024: £554,227 (an increase of 8% when compared to October 2023).
- 🏘️ The average asking price in Gravesend, for a terraced property, at October 2024: £341,163 (an increase of 3% when compared to October 2023).


Sales
- 📈 Total Accumulative Gross Sales YTD (1070) are 16% higher than 2023 YTD levels and 4% higher than 2022 levels.
- 🏡 Gross Sales for October: 125 properties were sold STC in October 2024, a 22% increase from last Octobers figures (102) and a 17% increase from last month's Gross Sales figures (107).
- 📉 Total accumulative Gross Sales YTD stand at 1070, which is 1% above the YTD average of the last 3 years of 1062 (2023/22/21).


If you have any questions or need further assistance, do not hesitate to contact the team. We are here and ready to help. 📞💬
📞 01474 321957
📧 sales@mandmprop.co.uk