GRAVESHAM PROPERTY MARKET UPDATE – May 2024 🏡
The Gravesham Property Market (DA11 & DA12). Here we look at data for new listings, sales and the time its currently taking to sell a property. Data up to May 31st, 2024 📅
Headlines for Gravesham
Listings 📋
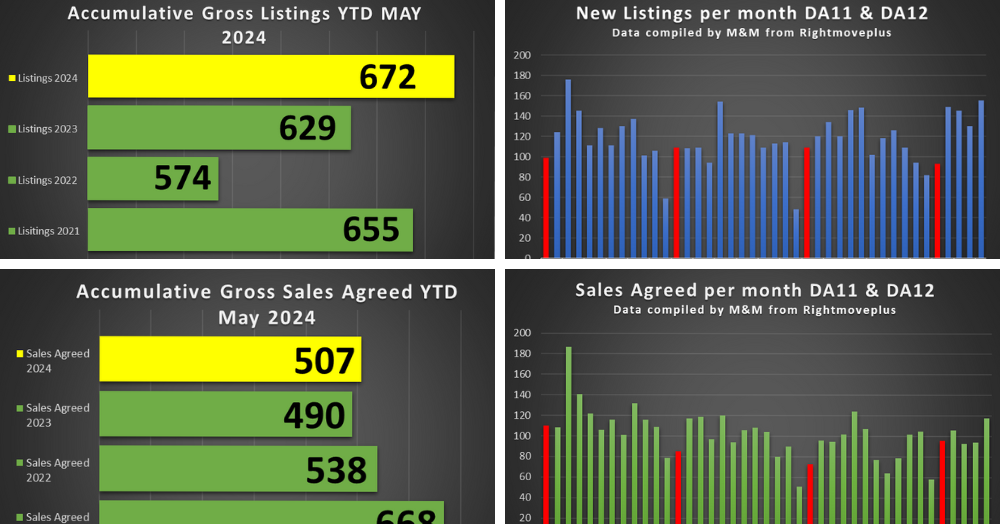
Listings for last month (May 2024) increased by 6% from May 2023 (from 146 to 155). 📈
Accumulative Total Gross Listings YTD are 6.8% higher than 2023 YTD levels and 17% higher than 2022. 📊
This year's YTD listings stand at 672, which is 9% higher than the historical 3-year YTD average of 619 properties. 📆


Average Asking Price 💷
The average asking price at May 2024: £349,372
The average national asking price in May 2024: £375,131
Sales 🏡
Total Accumulative Gross Sales YTD are 3.5% higher than 2023 YTD levels and 5.7% lower than 2022 levels. 📉
Gross Sales for May: 118 properties were sold STC in May, a 6% increase from last May's figures (146) and a 25.5% increase from last month's Gross Sales figures (94). 🔝
Total accumulative Gross Sales YTD stand at 507. This is a 10.26% decrease on the YTD average of the last 3 years of 565. (2023/22/21). 📉


